To read solar wind data for aurora prediction, focus primarily on the Bz value, which must be negative (southward) to allow energy transfer into Earth’s magnetosphere. Combine this with a solar wind speed above 450 km/s and density above 10 protons/cm³. While the Kp Index measures global geomagnetic activity, real-time solar wind data provides the immediate forecast needed for chasing the Southern Lights.
Introduction to Space Weather for NZ Chasers
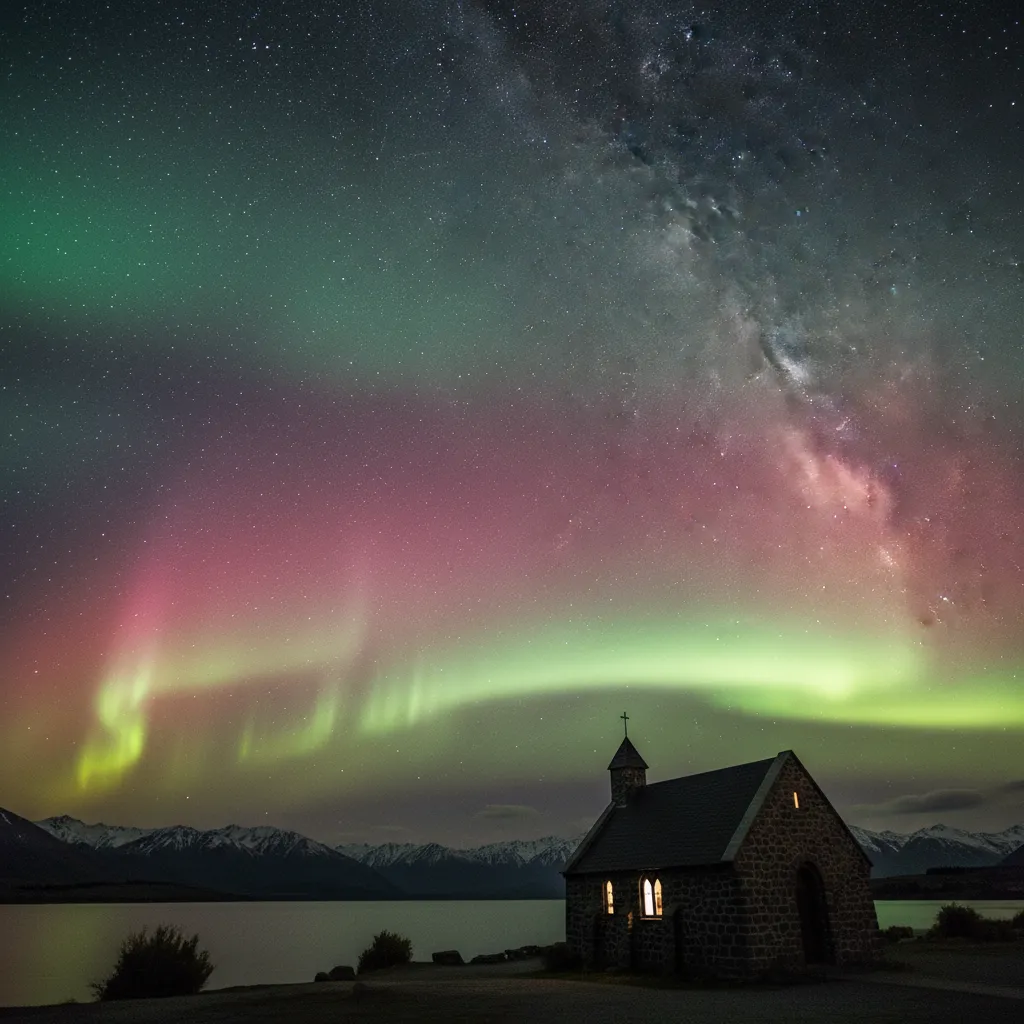
For astronomers, photographers, and tourism operators in New Zealand, understanding the nuances of space weather is the difference between capturing a world-class image of the Aurora Australis and sitting in the cold for nothing. While the Maramataka (Māori lunar calendar) has long guided us in reading environmental signals, modern aurora hunting requires a technical grasp of heliophysics.
Many novices rely solely on the Kp index, but this is often a lagging indicator. To predict the aurora with precision—especially in New Zealand’s unique geomagnetic latitude—you must learn to read the live data streaming from satellites located at the L1 Lagrange point, roughly 1.5 million kilometers upstream from Earth.

What are Bz and Bt Values?
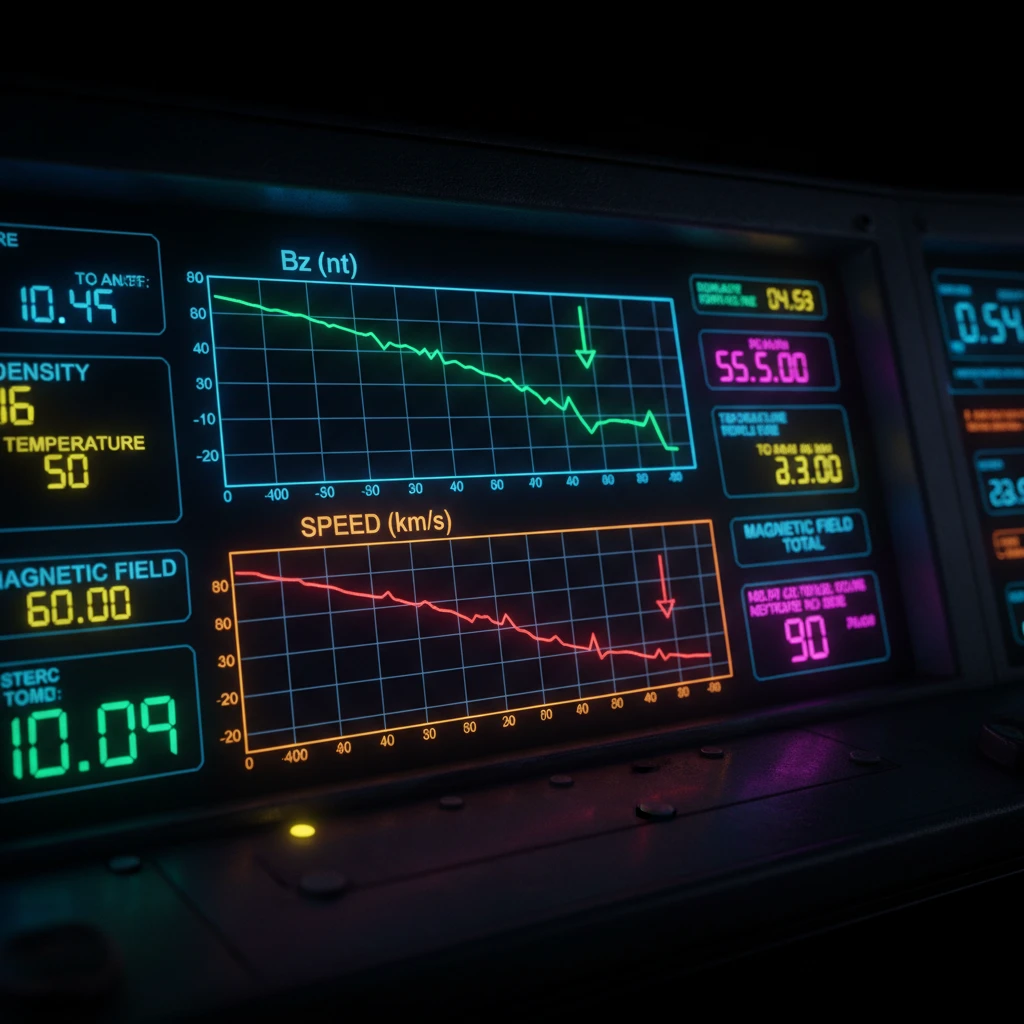
The most critical metrics on any solar data graph are the Bz and Bt values, which relate to the Interplanetary Magnetic Field (IMF). The IMF is the sun’s magnetic field carried out into the solar system by the solar wind.
What is Bt (Total Field)?
Bt stands for the total strength of the Interplanetary Magnetic Field. It is measured in nanoTeslas (nT).
- Low Activity: 5 nT or lower.
- Moderate Activity: 10 to 15 nT.
- Storm Level: 20 nT or higher.
Think of Bt as the potential volume of the storm. A high Bt indicates that the magnetic field within the solar wind is strong. However, a high Bt alone does not guarantee an aurora; the direction of that field is what matters most.
What is Bz (North-South Direction)?
Bz represents the north-south component of the IMF. This is the single most important data point for an aurora chaser.
- Positive Bz (Northward): When Bz is positive, the Earth’s magnetic field (which points north) repels the solar wind’s magnetic field. This acts as a shield, deflecting the energy. You will rarely see an aurora with a positive Bz, even if the wind speed is high.
- Negative Bz (Southward): When Bz turns negative (south), it cancels out Earth’s northward-pointing field. This event, known as “magnetic reconnection,” opens a crack in our magnetosphere, allowing solar particles to flood into the atmosphere and ignite the gases that create the aurora.
The Golden Rule for NZ: You want the Bz to be negative and the Bt to be high. A reading of Bt 15 and Bz -15 is a recipe for a spectacular show in the South Island. If the Bz fluctuates between positive and negative, the aurora will pulse or fade in and out.
Solar Wind Speed and Density
Once the door is opened by a negative Bz, the intensity of the display depends on the “fuel” arriving from the sun: the speed and density of the solar wind.
How to read Solar Wind Speed?
Solar wind speed is measured in kilometers per second (km/s). Under normal conditions, the solar wind flows at about 300 to 350 km/s. This is usually insufficient to cause significant geomagnetic unrest unless the Earth is under the influence of a Coronal Hole High-Speed Stream (CH HSS) or a Coronal Mass Ejection (CME).
- Active Conditions: 400–500 km/s.
- Storm Conditions: 500–700 km/s.
- Severe Storm: 800+ km/s.
Higher speeds impart more kinetic energy into the magnetosphere, pushing the aurora further north (towards the equator), making it visible from places like Wellington or even Auckland during extreme events.
How to interpret Proton Density?
Density is measured in protons per cubic centimeter (p/cm³). It represents the thickness of the solar wind cloud.
- Baseline: < 5 p/cm³.
- Good: 10–20 p/cm³.
- Excellent: > 20 p/cm³.
When a CME first impacts Earth, you will often see a sudden spike in density (a shockwave), followed by a spike in speed. High density brightens the aurora, making it visible to the naked eye rather than just camera sensors.
The Phi Angle and Polarity
Often overlooked by beginners, the Phi angle helps predict the stability of the solar wind connection. The Phi angle indicates the polarity of the IMF sector we are currently in—essentially, whether the magnetic field lines are pointing away from the Sun or toward it.
The angle is measured in degrees (0-360). Sudden changes in the Phi angle often signal the crossing of a “sector boundary” (the fold in the heliospheric current sheet). These crossings can trigger geomagnetic instability and spark auroras even without high wind speeds. While less critical than Bz, a shifting Phi angle can explain why activity might suddenly spike or drop when other data looks static.
What is the Kp Index?
The Planetary K-index (Kp) is a scale from 0 to 9 that quantifies disturbances in the Earth’s magnetic field. It is derived from the maximum magnetic fluctuations observed over a three-hour interval by ground-based magnetometers around the globe.
Why is Kp often misleading?
The Kp index is a lagging indicator. It tells you what happened over the last three hours, not necessarily what is happening right now. However, it is excellent for broad alerts and historical categorization.
Kp Requirements for New Zealand Viewing
Because New Zealand is located relatively close to the South Magnetic Pole, we do not need a Kp 9 to see the lights, but our requirements vary by latitude:
- Kp 3-4: Visible photographically from Stewart Island and the Catlins.
- Kp 5 (G1 Storm): Good naked-eye visibility in the lower South Island (Queenstown, Tekapo, Dunedin). Faint photographic visibility in Wellington.
- Kp 6-7 (G2-G3 Storm): Visible naked-eye in the central South Island; photographic potential for the central North Island (Taupō).
- Kp 8-9 (G4-G5 Storm): Visible across most of New Zealand, potentially as far north as Northland.

Hemispheric Power and Ovation Prime
For a more immediate assessment of auroral strength than the Kp index, look at the Hemispheric Power (HP) index. This is measured in Gigawatts (GW) and estimates the total energy being deposited into the upper atmosphere in your hemisphere.
For the Southern Hemisphere:
- < 20 GW: Quiet conditions.
- 20–50 GW: Unsettled to Active. The aurora is likely building.
- 50–90 GW: Storm levels. The auroral oval is expanding significantly.
- 100+ GW: Major storm. The sky is likely full of color.
This data feeds into the “Ovation Prime” model, which generates the visual forecast maps showing the auroral oval. If the model shows the red or yellow ring extending over the South Island, go outside immediately.
Real-time Data Sources for NZ
To successfully read solar wind data, you need reliable sources. The data comes from the DSCOVR and ACE satellites, but how it is presented matters.
1. NOAA Space Weather Prediction Center (SWPC)
This is the primary source for raw data. Look for the “Real-Time Solar Wind” plots. Remember to account for the time delay; the satellites are at L1, so the solar wind hits the satellite 15 to 60 minutes before it hits Earth (depending on wind speed).
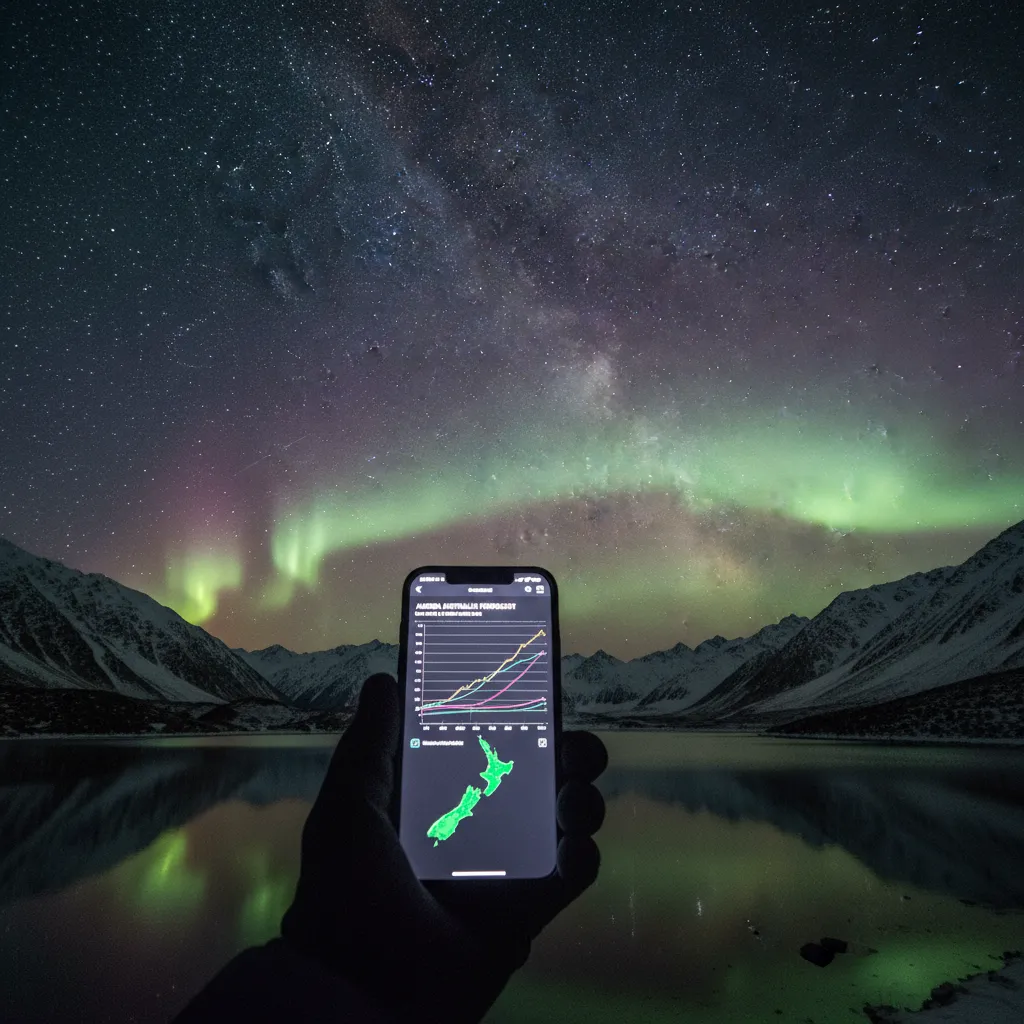
2. Glendale App
Extremely popular among New Zealand aurora hunters, the Glendale App aggregates data specifically for our region. It provides easy-to-read dials for Bz, Speed, and Density, and calculates a live probability of viewing based on your NZ location.
3. Space Weather Live
An excellent website and app that visualizes the Kp index, hemispheric power, and real-time solar wind with historical context. It is highly recommended for its clear interface.
4. Local Magnetometers
For the most accurate “now-cast,” check local magnetometers (like those operated by the University of Otago or local astronomy groups). If the local magnetic field traces show sharp dips (deflections), the aurora is overhead.
Summary: The Aurora Chaser’s Checklist
Before heading out into the dark New Zealand night, run through this mental checklist:
- Bz is Negative: Ideally -10nT or lower.
- Bt is High: Ideally 15nT or higher.
- Speed is Elevated: Above 450 km/s is preferred.
- Hemispheric Power: Above 50 GW.
- Sky Conditions: Clear skies (check MetService) and low light pollution.
By mastering these numbers, you move from hoping for an aurora to predicting one with scientific accuracy.
What is the best app for aurora alerts in NZ?
The Glendale App is widely considered the best for New Zealand specifically, as it uses local algorithms. SpaceWeatherLive is excellent for raw global data, and the “My Aurora Forecast” app offers good push notifications.
Does the moon phase affect solar wind data reading?
No, the moon phase does not affect the solar wind data itself (Bz, Speed, etc.). However, a Full Moon creates light pollution that can wash out faint auroras, meaning you need stronger solar wind data (higher Kp/lower Bz) to see the lights during a full moon.
How long does it take solar wind to reach Earth from the satellite?
Data from the DSCOVR satellite at the L1 point gives us a warning of 15 to 60 minutes. If the solar wind speed is fast (800 km/s), it arrives in ~20 minutes. If it is slow (300 km/s), it may take an hour.
Can you see aurora with positive Bz?
Generally, no. A positive Bz acts as a shield. However, if the solar wind density and speed are incredibly high (extreme shock), the sheer pressure can sometimes compress the magnetosphere enough to cause a display, but sustained shows require negative Bz.
What is a G-Scale storm?
The NOAA G-Scale ranks geomagnetic storms from G1 (Minor) to G5 (Extreme). A G1 corresponds roughly to Kp 5, while a G5 corresponds to Kp 9. G4 and G5 storms are rare and produce the most vibrant displays visible from further north.
Why is the aurora different colors?
The colors depend on which gas is being excited and at what altitude. Oxygen at high altitudes (200km+) glows red (rare). Oxygen at lower altitudes (100km) glows green (most common). Nitrogen produces purple and pink colors, often seen at the bottom of the curtain during active storms.